Text size
eBPF for Telecom: What We Learned Building Runtime Visibility for 5G and Modern Telco Networks

There is a moment in every 5G lab when the network stops behaving like a diagram.
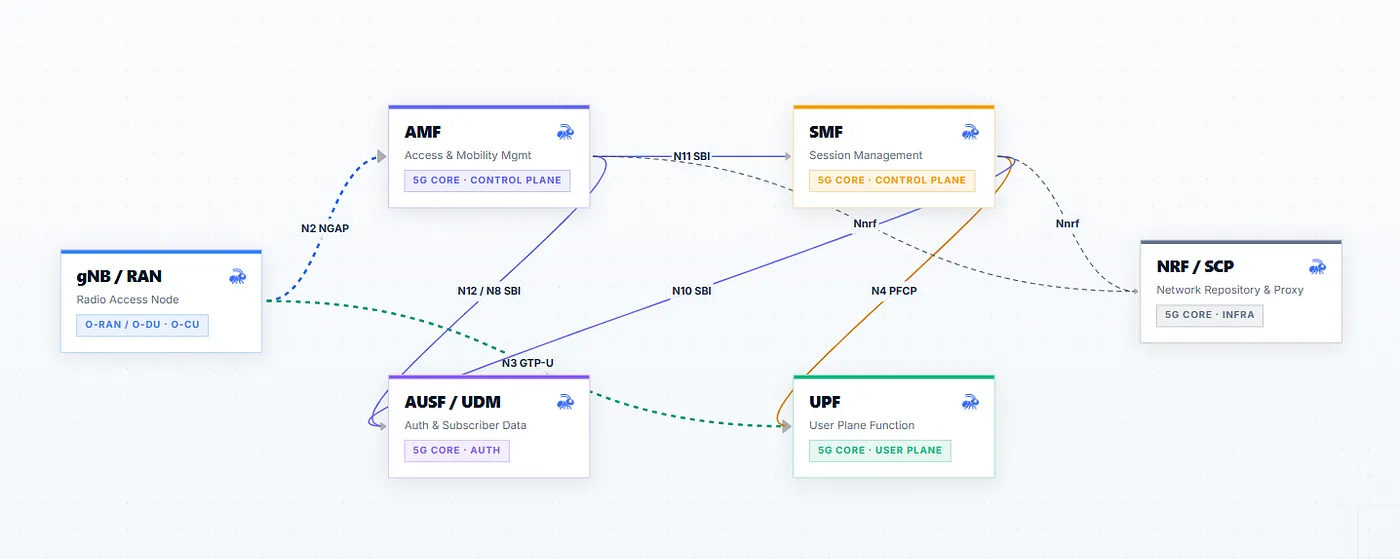
On the diagram, the AMF talks to the gNB over NGAP. The SMF controls the UPF through PFCP. The UPF forwards subscriber traffic through GTP-U tunnels. The service-based interfaces between core network functions use HTTP/2. The RAN side has CU and DU components, SCTP associations, and timing processes that must remain stable.
Then the lab starts running.
The AMF opens sockets. The SMF establishes PDU session control state and instructs the UPF through PFCP. The UPF binds UDP 2152 for GTP-U and UDP 8805 for PFCP. SCTP associations appear, restart, and disappear. A network function reads its configuration, spawns threads, restarts after a dependency fails, and sometimes behaves in ways that no clean architecture diagram prepared you for. One packet capture shows part of the story. Logs show another part. Kubernetes tells you where the pod was scheduled. None of them, alone, tells you what the Linux host actually saw when the network function moved.
That gap is where eBPF for telecom becomes interesting.
Not because eBPF is fashionable. Not because the telecom industry needs another dashboard. It becomes interesting because telecom networks are now software systems, and software systems leave runtime evidence. The Linux kernel sees process execution, socket ownership, namespace changes, file access, privilege changes, memory injection attempts, module loads, and packet paths. If we can connect that evidence to telecom protocols and network function roles, we get a much more accurate picture of what is happening inside a 5G network.
This article is a field note from building that system. The work started with practical experimentation around Open5GS and O-CU/O-DU-style (OCUDU) deployments, then grew into a telecom-aware eBPF sensor and console pipeline. The goal was not to build a generic Linux monitoring agent, but to answer a harder question:
Can an eBPF agent understand a telecom network function well enough to explain its runtime behavior?
The answer is yes, but only if the agent does more than collect events. It has to know that a process on UDP 8805 may be participating in PFCP. It has to know that UDP 2152 is not just a port, but a user-plane tunnel interface. It has to know that NGAP over SCTP belongs to the control plane, that an AMF spawning a shell is not normal, that a UPF using DPDK may be invisible to kernel packet capture, and that a PFCP heartbeat failure after an NF restart is not three unrelated events.
That is the difference between using eBPF in a telecom environment and building eBPF for telecom.
The Problem We Were Trying to Solve
In a normal cloud stack, observability usually begins with logs, metrics, traces, and Kubernetes metadata. That works well enough for many applications because the service model is flexible. A payment API can call another API. A worker can spawn a helper. A container can be redeployed. The operating assumptions are broad.
Telecom is less forgiving.
A network function has a role. That role implies expected protocols, ports, peers, process behavior, and operational blast radius. An AMF is not just a process. It is the access and mobility anchor for subscribers. An SMF is not just a microservice. It controls PDU session state and UPF rules. A UPF is not just a UDP-speaking workload. It is the user-plane forwarding point. A gNB-CU or gNB-DU is not just a pod with SCTP traffic. It participates in radio access signaling where peer identity, association stability, and, especially on the DU and fronthaul side, timing discipline matter.
When we experimented with Open5GS, this became obvious quickly. A simple UE registration creates a chain of events across NGAP, SBI, PFCP, and GTP-U. A restart of one component can ripple through session state. A configuration change can become a peer change. A missing GTP-U view might mean there is no traffic, or it might mean the user plane bypassed the kernel. If you only look at packets, you miss process intent. If you only look at logs, you miss what the workload did not report. If you only look at Kubernetes, you miss what happened inside the host.
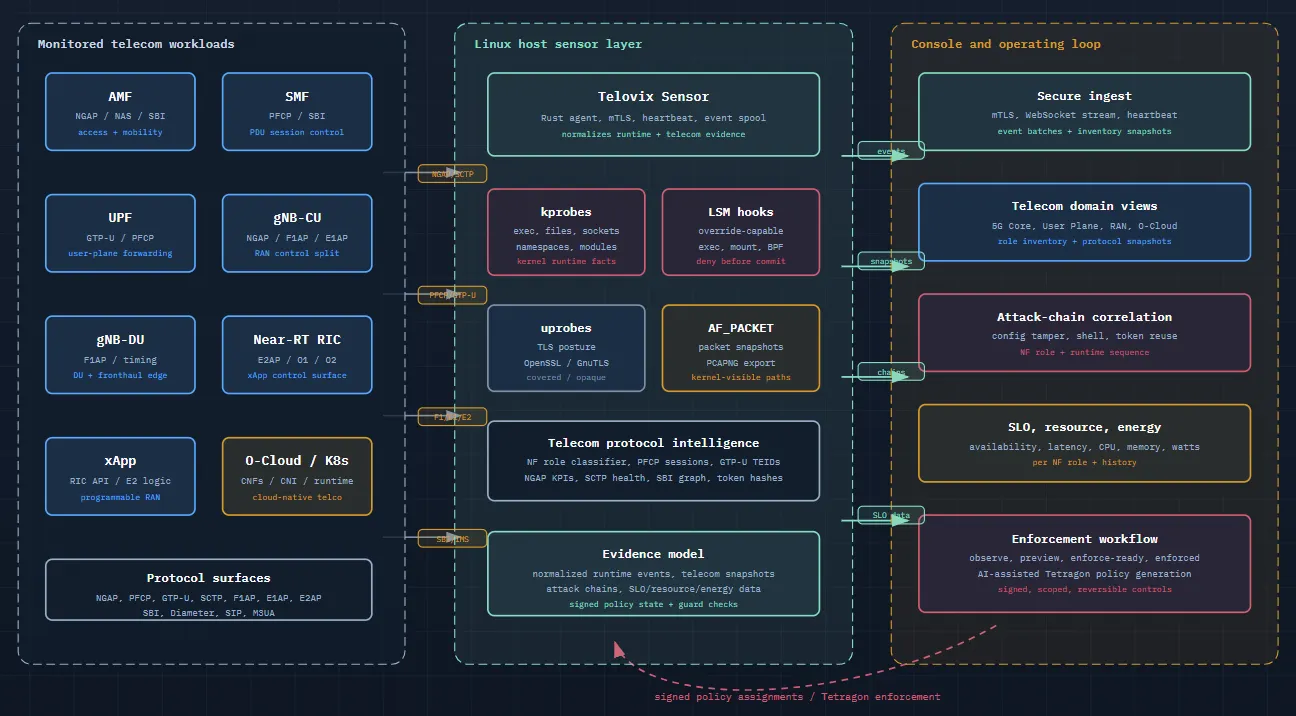
The sensor therefore had to combine four layers.
It needed kernel-level runtime visibility through eBPF. It needed packet and protocol awareness for telecom interfaces. It needed role classification so events could be interpreted in 5G language. And it needed a console that could present the result as telecom domains rather than a giant event dump.
That combination is the core of the system.
The Sensor Starts With Runtime Truth
The sensor is a Rust program that manages an embedded eBPF engine. It enrolls with the console, receives policy assignments, launches the runtime engine, and begins forwarding telemetry. The standard build observes Linux runtime behavior. The telecom build adds 5G Core, user-plane, RAN, and protocol-specific modules.
At the kernel and host level, the sensor observes the signals that usually explain what really happened. This includes process execution, forks and exits, network connects and accepts, TCP close events, UDP sends, listening sockets, DNS lookups, sensitive file opens and writes, privilege changes, namespace switches, executable memory mappings, memfd creation, ptrace activity, process memory writes, kernel module operations, raw socket creation, AF_XDP socket creation, and BPF health indicators.
That is the raw material. On its own, it is useful but still generic.
The telecom layer adds meaning. It watches for NGAP, PFCP, GTP-U, GTP-C, SCTP, F1AP, E1AP, XnAP, E2AP, SBI over HTTP/2, NAS content where visible, Diameter, RADIUS, SIP, M3UA, and IKEv2. It builds state around network function roles, PFCP sessions, GTP-U TEIDs, SCTP associations, TLS posture, SLO state, resource consumption, and telecom-specific anomaly chains.
The result is a sensor that can say more than “a process connected to a socket.” It can say, “this process is acting as an SMF, it is speaking PFCP to this UPF peer, the PFCP liveliness state degraded, and the session table changed after the process restarted.”
That is the kind of sentence operators need.
Role Detection Is the First Breakthrough
The first real breakthrough was role detection.
Without role detection, eBPF telemetry becomes a flood of Linux facts. With role detection, the same facts become telecom evidence. The sensor classifies running processes into network function roles using standardized behavior like port bindings, transports, process names, binary paths, socket ownership, peer direction, and repeated observation across heartbeat cycles.
The classifier recognizes core functions such as AMF, SMF, UPF, NRF, UDM, UDR, PCF, AUSF, BSF, NSSF, CHF, NEF, SEPP, and others. It also recognizes EPC and mixed-generation functions such as MME, SGW, PGW, HSS, PCRF, Diameter nodes, SIP/IMS nodes, RADIUS servers, and SIGTRAN gateways. On the RAN side, it identifies gNB N2 endpoints, CU-CP, CU-UP, DU, eNB, E2 nodes, Near-RT RIC behavior, xApps, OAM endpoints, and PTP timing nodes.
The sensor does this from behavior rather than hardcoding a single vendor implementation. Open5GS was a proving ground, not the target. A process using PFCP on UDP 8805, GTP-U on UDP 2152, NGAP on SCTP 38412, F1AP on SCTP 38472, E1AP on SCTP 38462, E2AP on SCTP 36421, Diameter on 3868 or 5658, SIP on 5060 or 5061, M3UA on 2905, PTP on 319/320, or SBI ports such as 7777 and 29500–29599 is giving standards-derived evidence about its role.
That mixed-generation coverage is important because real telecom networks are rarely clean diagrams. A modern operator may run 5G SA, EPC interworking, IMS, Diameter charging and authentication paths, RADIUS access, SIP signaling, SIGTRAN gateways, IPsec tunnels, and O-RAN components at the same time. The sensor therefore does not stop at AMF, SMF, and UPF. It can collect GTP-C, Diameter, RADIUS, SIP, IKEv2, and M3UA behavior as part of the same runtime model. That lets one investigation follow a subscriber-impacting issue across 5G core, EPC/IMS, authentication, accounting, and signaling interconnect components without losing the process and host evidence.
That role changes how every later event is interpreted. A shell is not just a shell if it was spawned by an AMF. A network connection is not just egress if it came from an SMF to an unexpected peer. A file write is not just filesystem activity if it touched NF configuration or key material before a peer changed. An executable memory mapping is not just a Linux event if it occurred inside the process tree of a classified UPF.
This is what generic runtime security systems usually miss. They can detect suspicious Linux behavior, but they often cannot explain why it matters differently on an AMF, SMF, UPF, CU, DU, or RIC.
What We Can See in the 5G Core
The 5G Core is where the agent’s capabilities become easiest to understand because the roles are familiar (AMF, SMF, and UPF).
For the AMF, the sensor watches NGAP over SCTP. In Open5GS experiments, this is where UE registration, NAS transport, context setup, context release, handover preparation, and NG setup behavior become visible. The agent does not merely record that SCTP traffic exists. It builds NGAP procedure context and KPI history so the console can answer questions such as whether Initial Context Setup failures are rising, whether NG setup failures are tied to one peer, or whether a signaling problem started after a runtime event on the AMF host.
The data extracted at this layer is intentionally operational. The agent tracks NGAP procedure codes such as InitialUEMessage, DownlinkNASTransport, UplinkNASTransport, InitialContextSetup, UEContextRelease, HandoverPreparation, and NGSetup. It keeps the RAN UE NGAP identifier when available, recognizes NAS transport context, and converts the stream of procedures into indicators such as Initial Context Setup failure rate, UE Context Release latency, handover success behavior, and NG setup failures. That means the console is not only saying “there is N2 traffic.” It is saying “this AMF is receiving registration and context setup activity from this RAN peer, and the failure pattern changed at this time.”
This matters because several important 5G security findings start at exactly this boundary. RANsacked, a 2024 CCS paper on fuzzing LTE and 5G RAN-core interfaces, showed how malicious input from a base station or user device can expose implementation flaws in cellular cores. SNI5GECT demonstrated practical 5G NR sniffing and message injection experiments using srsRAN and Open5GS. The older device-capability research from the paper “New vulnerabilities in 4G and 5G cellular access network protocols” showed that capability exposure and downgrade behavior can create identification, bidding-down, and battery-drain risks. Our agent is not claiming to secure the radio interface itself. Its job is to detect the runtime and core-side evidence those classes of attacks can leave behind decode error bursts, abnormal NGAP procedure rates, UE security capability downgrade indicators, SCTP churn, AMF crash loops, unexpected child processes after parser stress, and timing changes around registration or context setup.
That last distinction is important. A fuzzing campaign may deliver a malformed NAS or NGAP path. The eBPF sensor does not sit inside the AMF parser. It sees what happens when the parser is stressed, for example process exits, restarts, memory injection attempts, suspicious shell spawns, file changes, network peer changes, and protocol KPI degradation. This is how runtime evidence complements protocol testing. It does not replace fuzzing; it gives operators a way to recognize when production-like behavior starts to resemble the failure modes found by fuzzing research.
For the SMF, PFCP is the center of gravity. The sensor captures PFCP on UDP 8805 and tracks session state around establishment, modification, active-state changes, and deletion. It maintains reports for sessions, messages, SEIDs, metrics, inventory, liveliness, peer pairing, and setup RTT. This lets the console distinguish ordinary session churn from invalid SEIDs, SEID collisions, dead PFCP peers, peer session storms, and direction violations where a sender behaves outside its expected SMF/UPF role.
The PFCP layer extracts enough structure to reason about session intent. It records SEID state, message categories, peer direction, heartbeat behavior, session establishment and deletion patterns, and policy objects such as PDRs, FARs, and URRs when they are visible. PDR fields describe where traffic is matched. FAR behavior tells whether traffic is forwarded, duplicated, or dropped. URR thresholds help explain usage reporting and volume behavior. When the SMF establishes or modifies PDU session-related UPF state, the agent can follow the lifecycle from control-plane instruction to user-plane consequence.
This is where research on protocol tunneling, boundary bridging, and context integrity becomes relevant. The 2025 “Hidden Paths in 5G” work describes how user-plane traffic can cross intended trust boundaries when UPF forwarding logic, PFCP rule handling, identifier validation, or interface isolation are weak. CITesting, although focused on LTE cores, studies context integrity violations where unauthenticated or improperly authenticated procedure chains modify state belonging to other subscribers. The practical lesson for a runtime agent is to identifier state is security state. SEIDs, TEIDs, peers, directions, and session transitions are not just counters. They are the evidence that tells whether the control plane is preserving the boundaries the architecture assumes.
In a concrete case, a PFCP session storm can be a scale event, a misbehaving SMF, or an attack attempting to exhaust user-plane state. A direction violation can suggest a peer behaving outside its expected role. A sudden burst of deletes after an NF restart can explain subscriber impact. A SEID collision can point to implementation weakness, state corruption, replay-like behavior, or a test harness pushing the edge of the control plane. The agent does not collapse those cases into a generic “UDP anomaly.” It keeps the telecom vocabulary intact so an engineer can investigate the real failure mode.
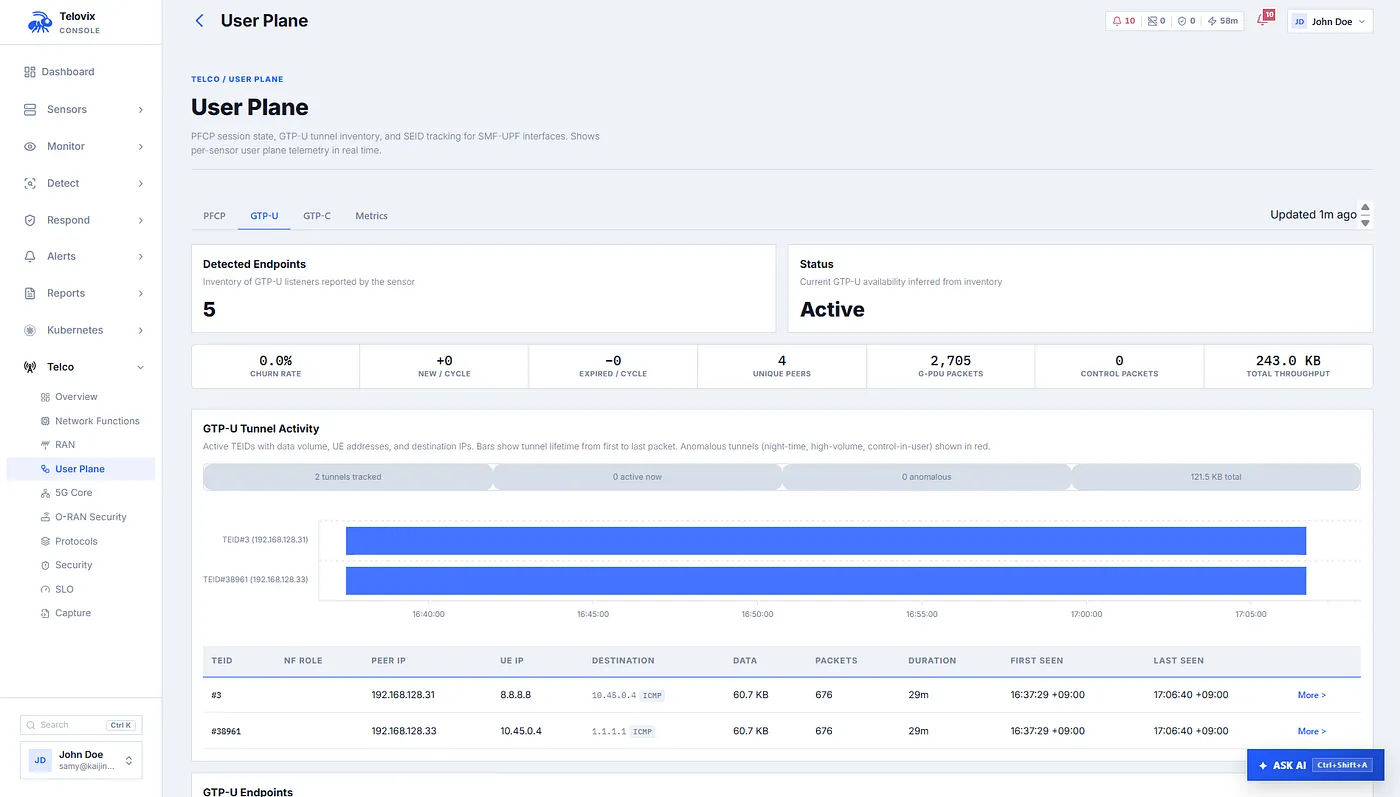
For the UPF, the agent watches the user plane through GTP-U and the control plane through PFCP. It extracts GTP-U metadata such as TEID, sequence information, message type, flags, inner PDU type, and endpoint role. It builds a TEID table and detects orphan TEIDs, TEID churn, TEID spray, unexpected peers, tunnel floods, encapsulation loops, and suspicious control-plane tunneling over the user plane.
GTP-U is deceptively simple. A TEID, a UDP port, and an inner packet can look like straightforward forwarding metadata. In a 5G core, they are also the thin line between expected user traffic and a path into places user traffic should never reach. The agent extracts version, PT, E/S/PN flags, message type, TEID, sequence number, inner PDU type, and endpoint role such as N3, N9, or S1-U. It then uses that data to build tunnel inventory and anomaly reports rather than treating every encapsulated packet as anonymous bytes.
The attack examples here are not theoretical. “Hidden Paths in 5G” describes protocol tunneling and network boundary bridging, including attacks such as UE-to-UE data injection, charging fraud through reflection or spoofing, and traffic interception paths involving rogue gNodeB behavior. The paper’s root causes map directly to what a telecom runtime sensor should watch TEID and SEID validation, unexpected peers, UPF forwarding behavior, interface trust boundaries, and control-plane-looking content inside user-plane paths. When the agent raises a GTP-U control-plane tunneling attack, TEID spray, orphan TEID, unexpected peer, encapsulation loop, or tunnel flood finding, it is detecting symptoms in the same family of boundary failures.
The value is not only in the alert name. It is in the surrounding evidence. Which UPF process owned the socket? Was it running in the expected namespace? Did PFCP create the session before GTP-U appeared? Did the TEID become active without a matching control-plane story? Did the peer match the learned interface matrix? Did a CNF drift event or CNI peer drift appear in the same window? The user plane is where false confidence is dangerous, so every GTP-U finding needs to be tied back to process, peer, namespace, and PFCP state.
The most important point is not that the agent can parse these protocols. Parsing is only the first step. The important point is that the agent can connect protocol state to the runtime identity of the process. A PFCP anomaly becomes more useful when it is tied to the SMF process that emitted it, the UPF peer that received it, the namespace it ran in, the process restart that preceded it, and the SLO state that followed.
That is the capability that changes the investigation.
The User Plane Taught Us to Be Honest About Visibility
GTP-U visibility is one of the places where telecom forces engineering honesty.
In a lab, AF_PACKET capture on the monitoring interface can see GTP-U packets and build tunnel inventory. In production-style UPF deployments, the packet path may be different. High-performance user-plane functions may rely on DPDK, VFIO, hugepages, AF_XDP, or other kernel-bypass techniques. When that happens, the Linux kernel may not see every packet in the normal path, and therefore an eBPF or AF_PACKET-based sensor cannot honestly claim complete GTP-U visibility.
So the agent detects the visibility gap itself.
It watches for AF_XDP socket creation, VFIO device access, hugepage usage, DPDK-style memory paths, IOMMU/VFIO indicators, and related runtime evidence. When those appear on a UPF or user-plane node, the console can show that GTP-U packet visibility is limited. PFCP, process behavior, resource metrics, privilege events, namespace state, file integrity, and kernel guard checks remain valuable, but the user-plane packet view is explicitly scoped.
The sensor treats this as a first-class finding because kernel bypass can be both an engineering choice and an attacker’s hiding place. A high-performance UPF may legitimately use DPDK or VFIO. A compromised node may also try to move traffic or tooling outside the ordinary kernel telemetry path. That is why the visibility-gap detector does not simply say “DPDK is bad.” It reports the evidence like AF_XDP sockets, VFIO access, hugepage use, DPDK-like file paths, mounts, process execution, and whether the process is associated with user-plane roles. The resulting question is operationally precise. Is this an expected UPF acceleration path, or did a new process create a blind spot on a telecom node?
The research connection is again the boundary-bridging problem. If adversarial traffic depends on a UPF forwarding path, then a packet sensor that quietly misses the actual forwarding path can mislead the operator. Honest visibility reporting is therefore part of the detection. A console that says “no GTP-U anomaly observed, but GTP-U visibility is limited because the UPF is using kernel bypass” is giving a better answer than a console that shows an empty tunnel table with confidence.
This matters because the absence of GTP-U data can mean two very different things. It can mean there is no user-plane traffic. Or it can mean the traffic bypassed the kernel. Those two interpretations lead to very different operational decisions.
An observability system that reports its blind spots is more valuable than one that silently overclaims.
RAN Signaling Is More Than SCTP Ports
RAN visibility begins with SCTP, but it does not end there.
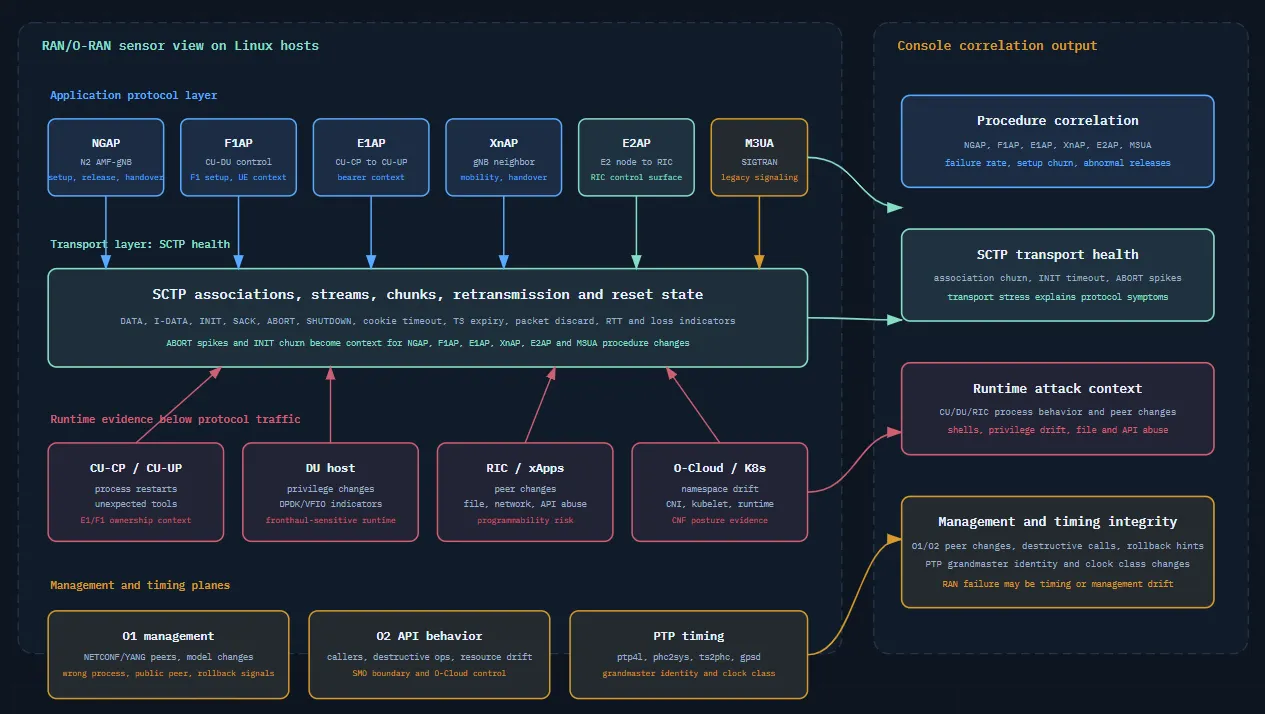
The sensor parses SCTP chunks, tracks association state, watches stream behavior, and reports transport health. It can detect ABORT spikes, INIT timeouts, retransmission patterns, packet discard, cookie timeouts, T3 expiry, and association churn. Those signals matter because SCTP carries much of the telecom control plane (NGAP, F1AP, E1AP, XnAP, E2AP, Diameter, and M3UA).
The SCTP parser extracts common headers and chunk types such as DATA, I-DATA, INIT, SACK, ABORT, and SHUTDOWN. It tracks fragments, stream counters, association state, RTT and loss indicators, reset patterns, and peer behavior. These are not glamorous fields, but they are often the first signs that the signaling plane is under stress. A burst of ABORTs before NGAP failures is different from NGAP failures with clean transport. Repeated INIT behavior from a peer can suggest instability, probing, or an attempt to force churn. Stream reset behavior can explain why upper-layer procedures are failing even when the application logs are late or incomplete.
Above SCTP, the telecom build understands RAN application protocols. It observes NGAP on N2, F1AP between CU and DU, E1AP between CU-CP and CU-UP, XnAP between neighboring gNBs, and E2AP between E2 nodes and the RIC. It also monitors M3UA lifecycle for SIGTRAN environments.
For RAN-core attack research, this is the layer where runtime detection becomes practical. RANsacked focused on the fact that RAN-core interfaces expose complex ASN.1 protocol parsers to inputs arriving through base-station-side and UE-triggered procedure paths. Low-layer attack research and SNI5GECT show that hostile or manipulated radio-side conditions can reach the core through realistic setups. The agent’s role is to catch the consequence at the Linux and telecom-procedure layer like malformed decode bursts, repeated setup failures, SCTP association churn, abnormal UE context releases, RAN process restarts, RIC peer changes, E2 procedure anomalies, or a DU/CU process suddenly changing privilege or spawning a tool it should never execute.
The RIC and xApp side deserves special attention because O-RAN makes the RAN more programmable. That programmability is powerful, but it also turns xApps, rApps, RIC APIs, and E2 connections into security-relevant runtime surfaces. The sensor can observe E2AP procedures, O1 and O2 activity, O-RAN API violations, unexpected RIC peers, and runtime behavior around xApp processes. Research on O-RAN zero-trust and federated learning repeatedly points to risks from compromised third-party apps, unauthorized access, model manipulation, lateral movement, and resource-control abuse. A telecom eBPF layer cannot decide whether an ML model is poisoned, but it can show whether the xApp process changed identity, opened a strange connection, accessed unexpected files, hit unauthorized APIs, or caused resource and timing behavior that does not match its baseline.
The management interfaces are part of the same story. O1 is not only “NETCONF on a port.” The agent can detect new O1 peers, public management peers, wrong processes owning O1 connections, YANG model version changes, rollback-like behavior, and hardware-failure reporting gaps. O2 is not only “a REST API.” The agent can watch O2 callers, public peers, destructive operations from non-SMO processes, orphaned resource behavior, and resource exhaustion patterns. Those are the controls an operator needs when a disaggregated RAN is managed through software interfaces instead of a closed appliance.
Timing is another area that generic observability usually misses. The sensor baselines PTP, SyncE, GNSS/GPS, and NTP-related daemons such as ptp4l, phc2sys, ts2phc, synce4l, gpsd, chronyd, ntpd, and timemaster. It watches daemon restarts, daemon termination, timing configuration writes, new PTP peers on ports 319 and 320, public grandmaster peers, grandmaster IP changes, grandmaster clock identity changes, and clock class degradation or recovery. This matters because RAN timing failure can look like a radio or hardware problem while the root cause is a compromised timing daemon, a rogue grandmaster, or a configuration change. In a URLLC or fronthaul-sensitive environment, a few timing facts can explain what a thousand generic process events cannot.
This gives the console a layered view. If NGAP failures rise, the operator can inspect AMF runtime behavior, SCTP health, peer state, and NGAP procedure data together. If F1AP setup becomes unstable, the investigation can include DU process behavior, SCTP association state, and RAN lifecycle events. If E2 behavior changes, the system can look at RIC peers, xApp behavior, and unexpected processes on E2-related ports.
This is the pattern throughout the platform, protocol events are never left alone. They are tied back to runtime evidence.
SBI, HTTP/2, and Token Abuse
The 5G service-based interface creates a different visibility problem. It is HTTP/2-based, often encrypted, and full of application-level relationships between network functions.
The sensor includes HTTP/2 and SBI-specific capability. It can process h2c traffic, parse HTTP/2 frames, handle HPACK context, build an SBI API report, track caller relationships, and produce a network function graph. In Open5GS-style development environments where SBI may be cleartext, this gives direct visibility into which NF called which service and which paths were slow or failing. In production environments, the TLS posture layer becomes important because payload visibility depends on whether the TLS library can be instrumented.
The fields matter here because SBI abuse often hides in ordinary-looking API traffic. The agent builds an API catalog, caller matrix, and NF graph. It watches which role calls which service, which HTTP/2 paths appear, which calls are slow, which calls fail, and whether the caller relationship is expected for that role. In a lab, this makes Open5GS easier to reason about because NRF, AMF, SMF, AUSF, UDM, PCF, and other functions can be viewed as a living graph rather than a list of containers. In a production-style environment, the same model gives the operator a way to detect role confusion, unexpected service use, and latency outliers.
The SBI module goes beyond status codes. It tracks high error rates, consecutive error bursts, P95 path latency, unauthorized caller policy violations, cross-plane violations, reconnaissance methods such as OPTIONS, TRACE, or CONNECT on SBI endpoints, destructive method misuse, producer mismatch, and NF graph violations where a caller and callee relationship does not fit the expected 3GPP service graph. It also looks for C2-like abuse patterns over SBI, such as abnormally high call frequency after baseline learning or unusually large response bodies that could hide command delivery or data movement inside what looks like NF-to-NF API traffic.
One particularly important capability is SBI token monitoring. The sensor tracks bearer token usage by hash, never storing the raw token. It records the first NF role and PID associated with a token hash, then alerts when the same token appears from a different NF role or spreads across too many PIDs in one cycle. This is designed to detect cross-NF OAuth token reuse patterns such as token theft and replay between network functions.
This was influenced by a simple observation: in a service-based architecture, identity material is as sensitive as packets. If a token that first appeared in an AMF context later appears from a different NF role, the problem is not just “an HTTP request happened.” It may be stolen credentials, replay, cross-NF token reuse, or a compromised process borrowing another function’s identity. The sensor stores only token hashes, limits token state, and ages old entries out, but it still gives enough evidence to detect token movement. It can also report token PID spread when the same role suddenly uses the same token from too many processes, a pattern that can indicate injection, proxying, or unexpected process fan-out.
The enforcement story begins to matter at this point. If the console sees that a token abuse finding is accompanied by an AMF spawning a curl process, a package manager reaching the internet, or a child shell connecting to an unexpected peer, an operator can move from observation to a carefully scoped response. The right response may not be “block SBI.” It may be “kill ptrace attach against NF processes,” “block execution from /tmp on this sensor group,” or “deny memfd-based payload staging.” The telecom signal tells you where to look; the runtime enforcement layer gives you practical host-level control.
This is a good example of the difference between network observability and telecom security. A generic system may see an HTTP/2 request. A telecom-aware system asks whether the caller role, token behavior, path, latency, and TLS posture make sense for that NF.
TLS Visibility Without Pretending to Decrypt Everything
TLS is another place where the agent has to be precise.
The sensor instruments supported TLS libraries with uprobes. It can attach to OpenSSL, GnuTLS, Go TLS, and BoringSSL paths, including common read and write functions such as SSL_write, SSL_read, SSL_write_ex, SSL_read_ex, GnuTLS record send/receive functions, Go TLS read/write methods, and BoringSSL equivalents.
The goal is not to claim universal decryption. The goal is to classify what kind of visibility exists. A connection may be plaintext, visible through a supported TLS uprobe, opaque because TLS exists but the library is not hookable, or unknown while the system waits for stronger evidence.
This distinction is critical in telecom. A development Open5GS deployment may expose h2c SBI traffic. A production NF may use dynamically linked OpenSSL and be visible through uprobes. A vendor build may statically link its TLS library and become opaque. A stripped container image may prevent clean library resolution. A Go binary may be affected by inlining. These are different realities, and the sensor reports them differently.
In practice, this gives the console a TLS inventory by network function role and interface. It can show where SBI is plaintext, where TLS is covered, and where TLS is opaque. That becomes operational context before an engineer trusts payload-level correlation or enables stronger enforcement.
TLS posture also becomes a downgrade detector. Plaintext SBI in a lab may be expected. Plaintext SBI on a production path that previously showed TLS evidence is a different signal. The agent can raise that change as a posture anomaly instead of treating both states as identical. This helps detect accidental misconfiguration, certificate path regressions, sidecar or proxy bypass, and attack chains where runtime tampering is followed by weaker transport security.
There is a subtle but important point here for readers searching for eBPF for telecom. eBPF can attach very close to the runtime, including user-space library calls through uprobes, but it should not be described as magic decryption. The credible capability is conditional visibility with evidence. Supported dynamic TLS libraries can be instrumented. Opaque builds are reported as opaque. Unknown states remain unknown. That discipline makes the rest of the article more believable because the same honesty applies to GTP-U, DPDK, and protocol parsing.
Runtime Security Around Network Functions
The sensor also watches the host for behavior that should not occur inside telecom network functions.
A production AMF should not spawn a shell. An SMF should not run a package manager. A UPF should not suddenly execute a binary from /tmp or /dev/shm. A RAN process should not start a debugger. A core network function should not create executable anonymous memory, use memfd to stage fileless code, change privilege unexpectedly, enter a new network namespace, or access cloud metadata endpoints.
The agent detects these behaviors from kernel and process telemetry, then enriches them with NF role context. It watches for process execution, parent-child relationships, mutable-path execution, memfd creation, executable memory mapping, ptrace, process memory writes, capset changes, setuid/setgid transitions, SUID/SGID file mode changes, namespace entry, raw sockets, kernel module loads, config writes, certificate or key access, management egress, unexpected listeners, unexpected peers, and CNI management-plane misuse.
The internal red-team style tests in the security-research folder are useful because they show how ordinary Linux behaviors become meaningful when sequenced. A binary named like a system daemon executed from /tmp is masquerading. A curl request to a literal-IP endpoint can be a bootstrap artifact fetch. A shell running chained reconnaissance commands can indicate automated post-exploitation. An HTTP POST to an exfil path is stronger when it follows credential or system discovery. A periodic curl loop becomes beaconing when the timing is consistent. These are generic host behaviors, but on a telecom node they carry higher consequence because the same host may terminate N2, N3, N4, SBI, E2, or O1/O2 control traffic.
This is why role-aware runtime detection is more powerful than a global deny list. /usr/bin/curl is not malicious. curl launched as a child of an AMF, reaching a literal-IP endpoint after a suspicious config write and before an SBI token reuse finding, is a story. memfd_create is not always malicious. A fileless payload staged under a UPF process tree after a TEID flood is a different story. ptrace is a debugging tool. ptrace attaching to an SMF in a live core is an incident until proven otherwise.
The host surface is broader than child processes and file paths. The sensor detects access to container runtime admin sockets such as Docker, containerd, CRI-O, Podman, Kata, and gVisor sockets. On a 5G core node, a network function touching a container runtime socket is not a harmless curiosity; it can mean host control, container escape, lateral movement, or compromised orchestration. The sensor also detects Kubernetes service-account token access, kubeconfig reads, kubelet PKI access, cluster PKI access, API server DNS lookups, API server connections, etcd connections, kubelet API connections, and control-plane port access. When the process is a classified telecom NF, the severity is raised because an AMF or UPF reading cluster credentials is a very different event from a Kubernetes system component reading them.
Container escape behavior receives the same NF-aware treatment. The agent elevates setns, unshare, mount, and chroot activity when it comes from a telecom NF or a child of one. Entering the host network namespace can allow traffic manipulation. Entering the host PID namespace can enable tracing or signaling other host processes. Entering the host mount namespace can expose filesystems that should be outside the container. Creating a user namespace can become a privilege escalation step. These are common Linux primitives, but they are not normal AMF, SMF, UPF, RIC, CU, or DU behavior.
The I/O plane has its own set of signals. The visibility-gap detector tells the operator when DPDK, VFIO, hugepages, AF_XDP, or similar fast paths limit packet visibility. A separate misuse detector asks whether those same capabilities are appearing where they do not belong. A UPF may legitimately use DPDK. A control-plane NF such as AMF, SMF, NRF, PCF, AUSF, UDM, UDR, CHF, BSF, NEF, SEPP, or NSSF has no normal reason to access VFIO, UIO, or hugepage-backed DMA infrastructure. The sensor can also detect SR-IOV virtual function count modification, which is effectively a network topology change at the host level.
The CNI detection is worth calling out. On Kubernetes-based telecom deployments, the network plugin is part of the traffic reality. The sensor can detect non-CNI processes, especially classified network functions, accessing CNI management ports such as BGP, Cilium, Hubble, Calico Typha, OVN, Weave, webhook, or kubelet-related ports. It also learns CNI agent peers and detects peer drift after the learning window. That is not a telecom protocol event, but it is highly relevant to telecom CNFs because route manipulation and CNI compromise can change how the network behaves.
The agent also includes CNF image and runtime drift detection. If a containerized process executes from writable locations such as /tmp, /dev, /dev/shm, /var/tmp, /run, /proc/PID/fd, home directories, or overlay upper layers, the sensor can treat that as image drift. It enriches the finding with Kubernetes image identity, digest, pod, namespace, workload, container name, process name, and NF role when available. This helps detect post-deployment payload injection inside CNFs.
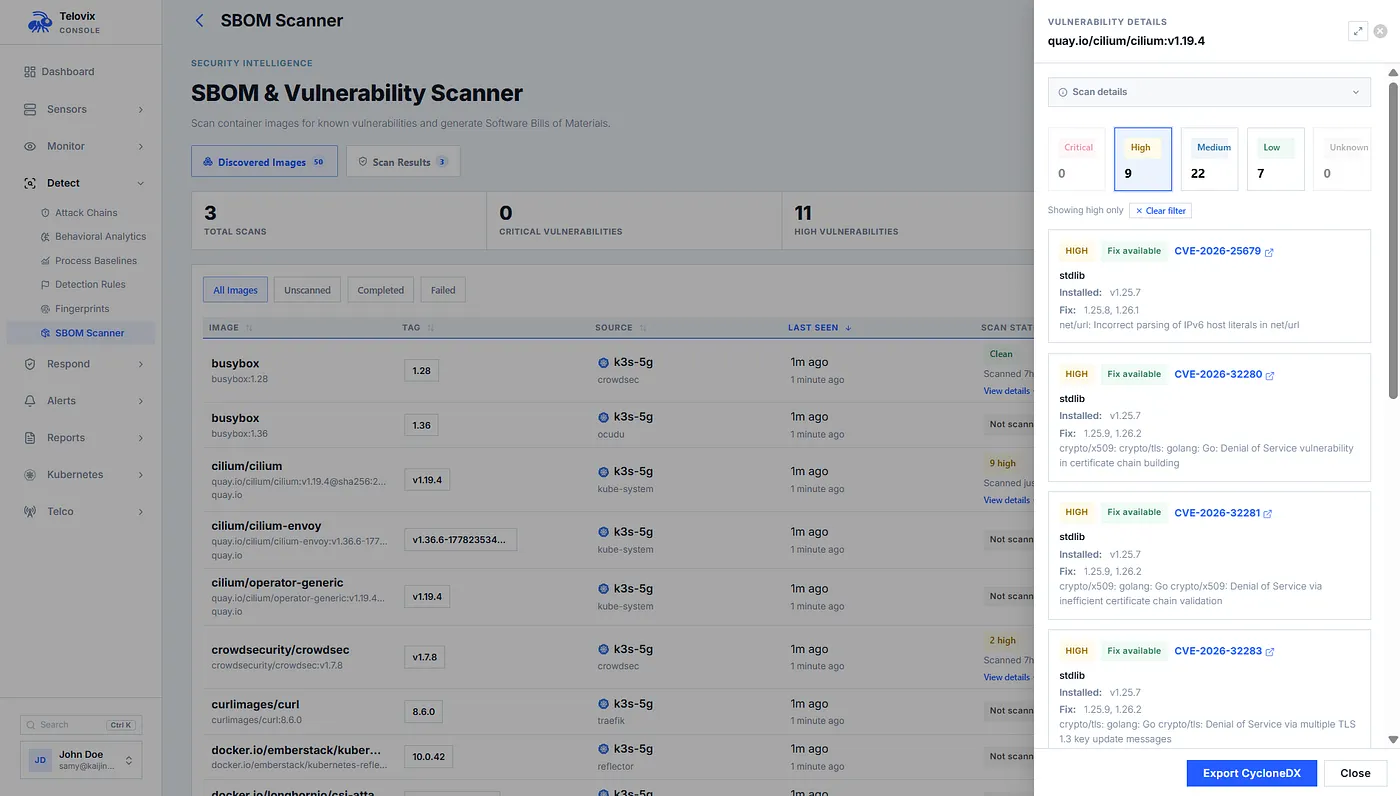
The standard security layer continues underneath all of this. The sensor builds SHA-256 file-integrity baselines for system binaries, libraries, credentials, SSH configuration, persistence paths, authentication logs, PAM files, dynamic linker files, and service definitions. It enriches events with process ancestors, workload context, cgroup information, Kubernetes namespace, workload name, container identity, and network namespace. It can scan container images with Trivy for SBOM and CVE visibility. It builds per-binary behavioral baselines over a learning window and scores spawn behavior, network behavior, file behavior, and command-line argument patterns. High-signal events such as ptrace, file-integrity alerts, module loads, BPF map updates, and shell-injection-like arguments can bypass the learning delay because they are too important to bury.
Network slicing research makes the same point from a different angle. Slicing security failures often involve orchestration, virtualization, inter-slice communication, API abuse, configuration tampering, and weak isolation. Those are not always visible in a packet capture. They appear as runtime facts: a privileged pod, a mutable root filesystem, host networking, host PID access, SYS_ADMIN capability, namespace drift, CNI peer drift, unexpected listeners, or a process escaping the image it was deployed with. The sensor captures those facts and connects them to NF role, Kubernetes identity, and telecom interfaces.
The O-Cloud monitoring change request in the research folder is blunt about the limitation of basic logs. Kubernetes audit logs may show that an exec session started, but they do not necessarily show what command ran inside the session. Syslog can be too coarse, too late, or too easy to bypass from inside a compromised VNF or CNF. Kernel-level telemetry fills that gap by observing execution, file access, network activity, privilege changes, and container behavior at the point where the workload actually runs.
Generic security products often detect some of these behaviors. The differentiator here is that the event is interpreted through telecom role context and then correlated with protocol state.

From Events to Chains
The strongest detections are not isolated events. They are chains.
One chain we built looks for configuration tamper followed by control-plane behavior change. A file write to a configuration, certificate, or key path is interesting. An NF restart after that write is more interesting. A new unexpected peer after the restart is the real story. The system can connect those steps and produce one telecom-specific finding instead of three disconnected alerts.
Another chain tracks NF restart to PFCP session loss. The system observes that an SMF, UPF, or PFCP-capable EPC CUPS function such as SGW-C/PGW-C exited. It then watches PFCP heartbeat state and session deletion activity. If the sequence completes inside the correlation window, the console can explain the operational impact: the NF exited, PFCP liveliness failed, and sessions were lost.
The TLS downgrade path is similar. Plaintext SBI is already important. Plaintext SBI after previous TLS evidence is more serious because it suggests a change in posture, not just a lab misconfiguration.
The sensor also monitors itself. Kernel guard checks track kprobe counts, BPF filesystem mount state, unprivileged BPF posture, kernel module baselines, and event loss signals. On telecom nodes, sensor tamper is not just an observability problem. It can be part of an attack chain because the attacker may be trying to blind the runtime evidence layer.
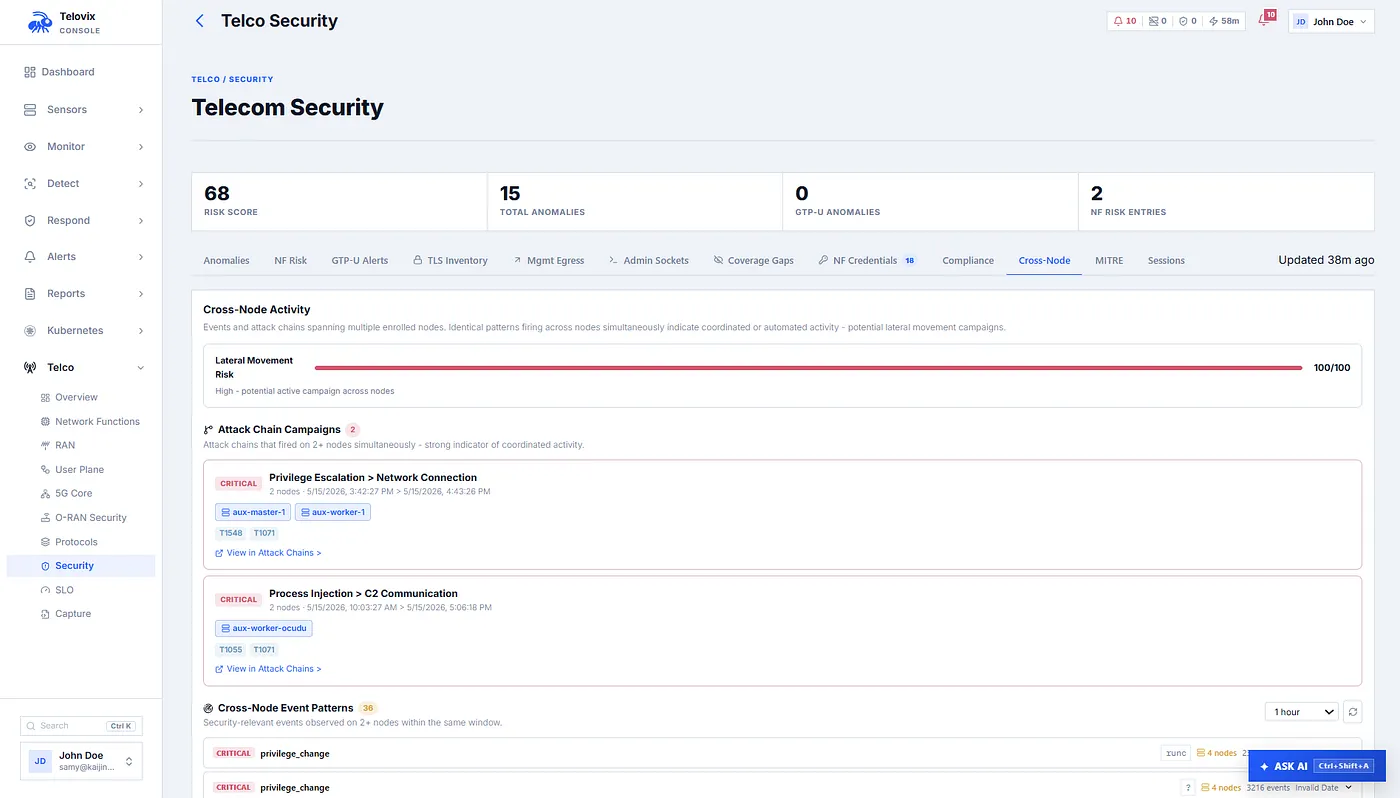
The backend adds another layer of attack-chain correlation across the event stream. It can connect process injection to outbound C2, privilege escalation to a network connection, inbound network accept to shell spawn, defense evasion to namespace creation, kernel module load to network communication, credential file access to suspicious DNS, and file-integrity change to later execution of the modified binary. These chains are not telecom-specific by themselves, but they become far more useful when the binary is an AMF, SMF, UPF, CU, DU, RIC, xApp, Diameter node, SIP component, or subscriber datastore process.
There is also a blast-radius model. The system does not treat every compromised process as equal. A critical event on an AMF, NRF, SEPP, MME, or HSS has network-wide implications. A UPF or SMF event has session-scope impact. A gNB, CU, DU, Near-RT RIC, or E2 node event has RAN-scope impact. NSSF, CHF, NEF, BSF, SMSF, LMF, and GMLC can affect slice selection, charging, exposure APIs, binding support, messaging, and location services. IMS, Diameter, and SIGTRAN affect voice and interworking. PTP and OAM affect infrastructure trust. That model lets the console annotate events with scope and impact instead of relying only on generic severity.
This is the direction cybersecurity writing should take as well and show the sequence, not only the vocabulary. A reader remembers a story of cause and effect more than a catalog of event kinds.
Availability, Latency, and Energy Are Part of Security
One thing we learned while building the telecom layer is that security and operations cannot be cleanly separated in 5G.
An NF restart can be an operational fault, but it can also be the second step in a tamper chain. A PFCP liveliness failure can be a network issue, but it can also explain session loss after a suspicious process event. A CPU spike can be normal radio activity, but it can also coincide with a memory injection attempt or tunnel flood.
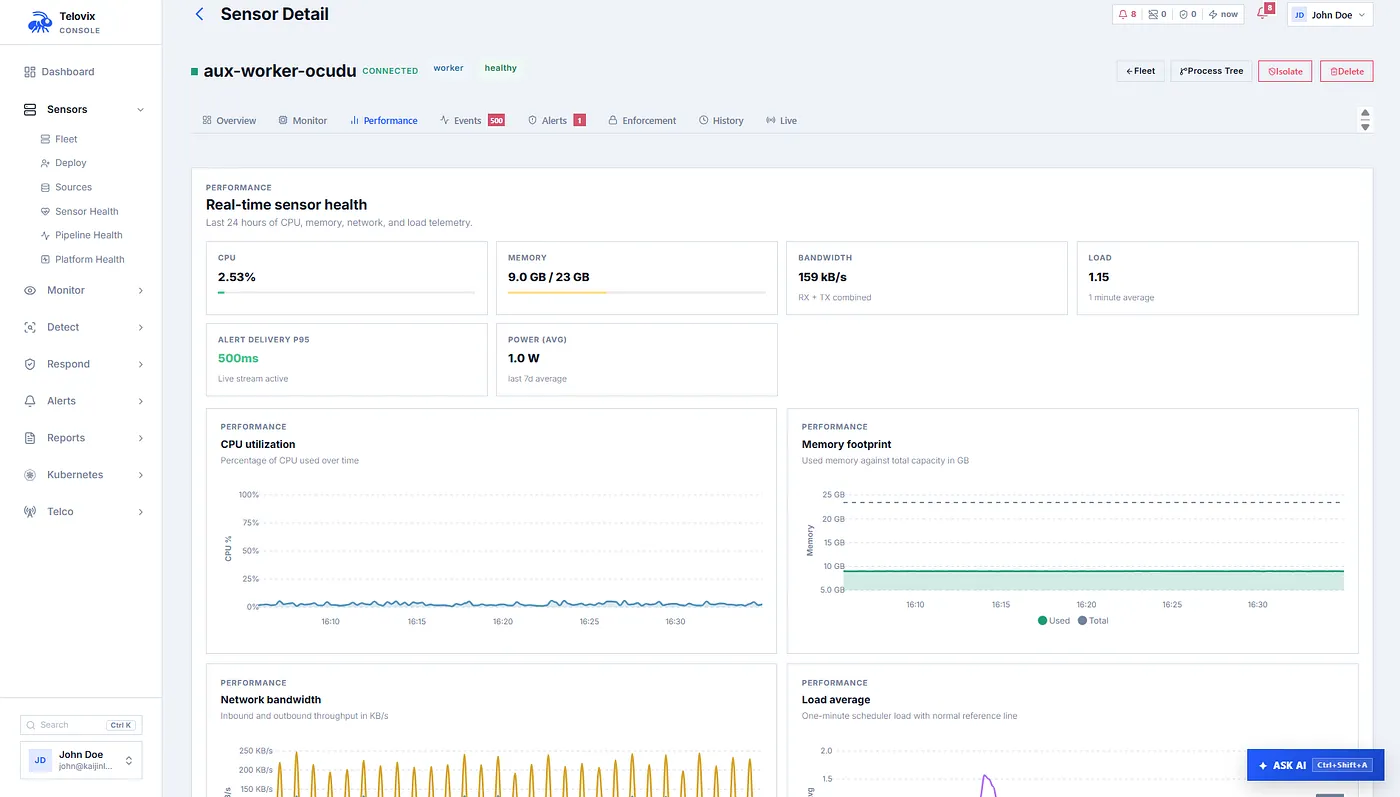
The sensor therefore reports SLO, latency, and resource data alongside security telemetry.
For each network function role, it tracks availability, uptime, restart count, MTTR samples, breach state, and recovery state. It also tracks latency indicators such as DNS resolution time, connection setup time, SBI path latency, PFCP setup RTT, and SCTP health. The console can combine these into interface-level scores for SBI, N4/PFCP, N2/SCTP signaling, N3/GTP-U, and overall NF availability.
The resource layer goes deeper than node-level CPU and memory. The sensor joins process snapshots with stable NF classifications, then attributes CPU, RSS memory, virtual memory, and thread count to each network function role. It can show that the UPF is the top CPU role, that the AMF memory footprint changed, or that unclassified processes are consuming unexpected resources on a telecom node.
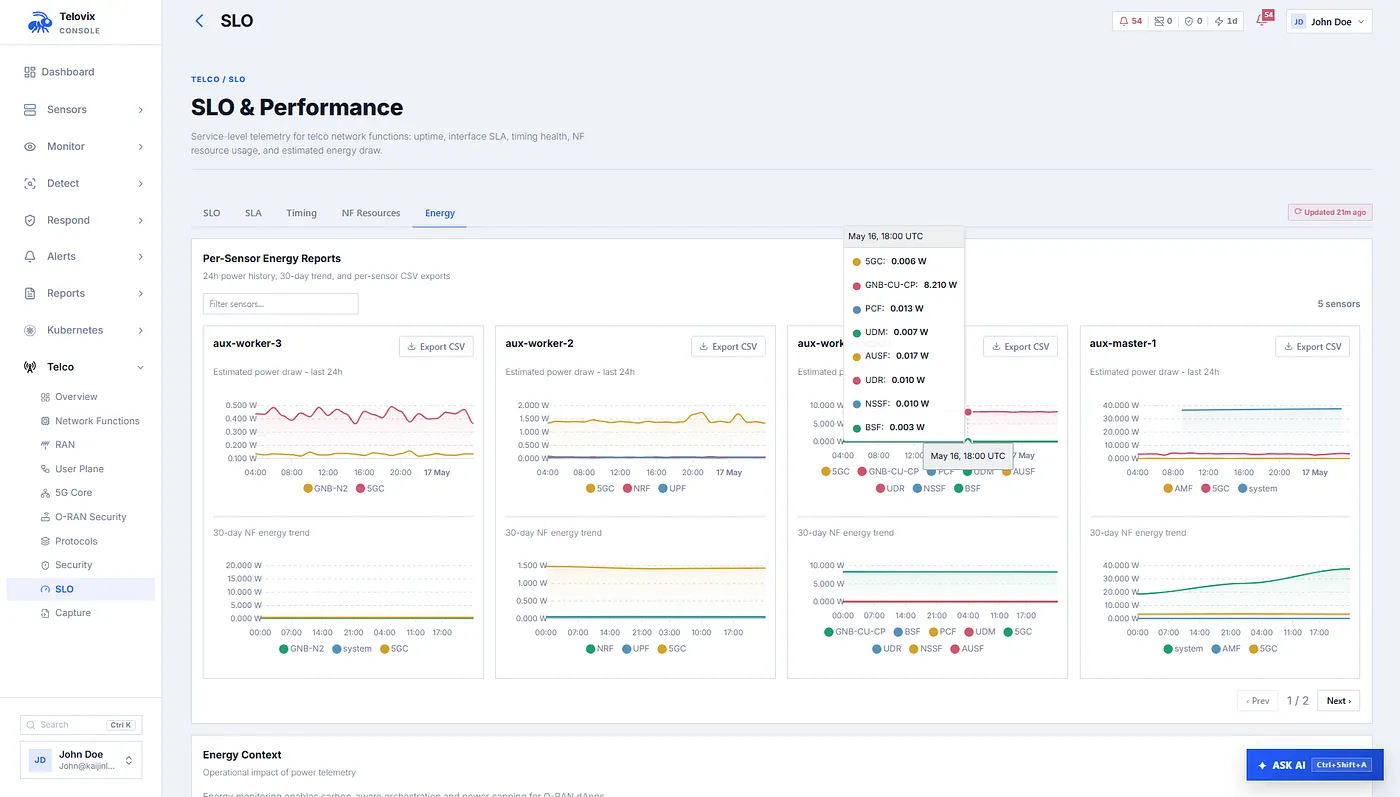
The energy layer builds on that. The sensor estimates per-role power consumption using CPU utilization and system TDP. It reads Intel RAPL data where available, falls back to an embedded CPU model database for common Intel Xeon, AMD EPYC, ARM Neoverse, Ampere, Graviton, and lab CPUs, and finally uses conservative vendor defaults. The report includes estimated watts per role, percentage of system TDP, total NF watts, CPU percentage used for the estimate, TDP source, CPU model, logical CPU count, and methodology.
This is not a replacement for hardware power meters. It is a transparent operational estimate. In distributed telecom, that matters. Edge deployments multiply small overheads across many nodes, and operators need to understand which network functions are driving resource and energy cost.
Energy is also a security signal when treated carefully. Battery-drain research in cellular systems shows that protocol behavior can be used to waste device power. O-RAN optimization research studies energy-aware control loops and adversarial conditions around those loops. On the infrastructure side, a tunnel flood, PFCP storm, crash loop, rogue xApp, or repeated registration failure can show up as CPU, thread, memory, latency, and wattage movement. The point is not to claim that watts identify an attack by themselves. The point is that energy and resource changes are part of the chain when they align with telecom anomalies.
For example, a UPF might become the top CPU role at the same time GTP-U tunnel flood indicators appear. An AMF may show increased CPU and NGAP failure rate after a fuzzing-like decode burst. A RIC node may show xApp resource change after unauthorized API attempts. A subscriber database may show unusual process children or backup-tool execution around high CPU and management egress. Those are the cases where energy and resource attribution stop being dashboard decoration and become investigative context.
The console stores hourly NF resource history and exposes energy reports, per-day watt averages, per-role watt breakdowns, fleet energy summaries, savings estimates versus a configured userspace-agent baseline, and CSV export. That makes energy part of the same investigation surface as runtime and protocol behavior.
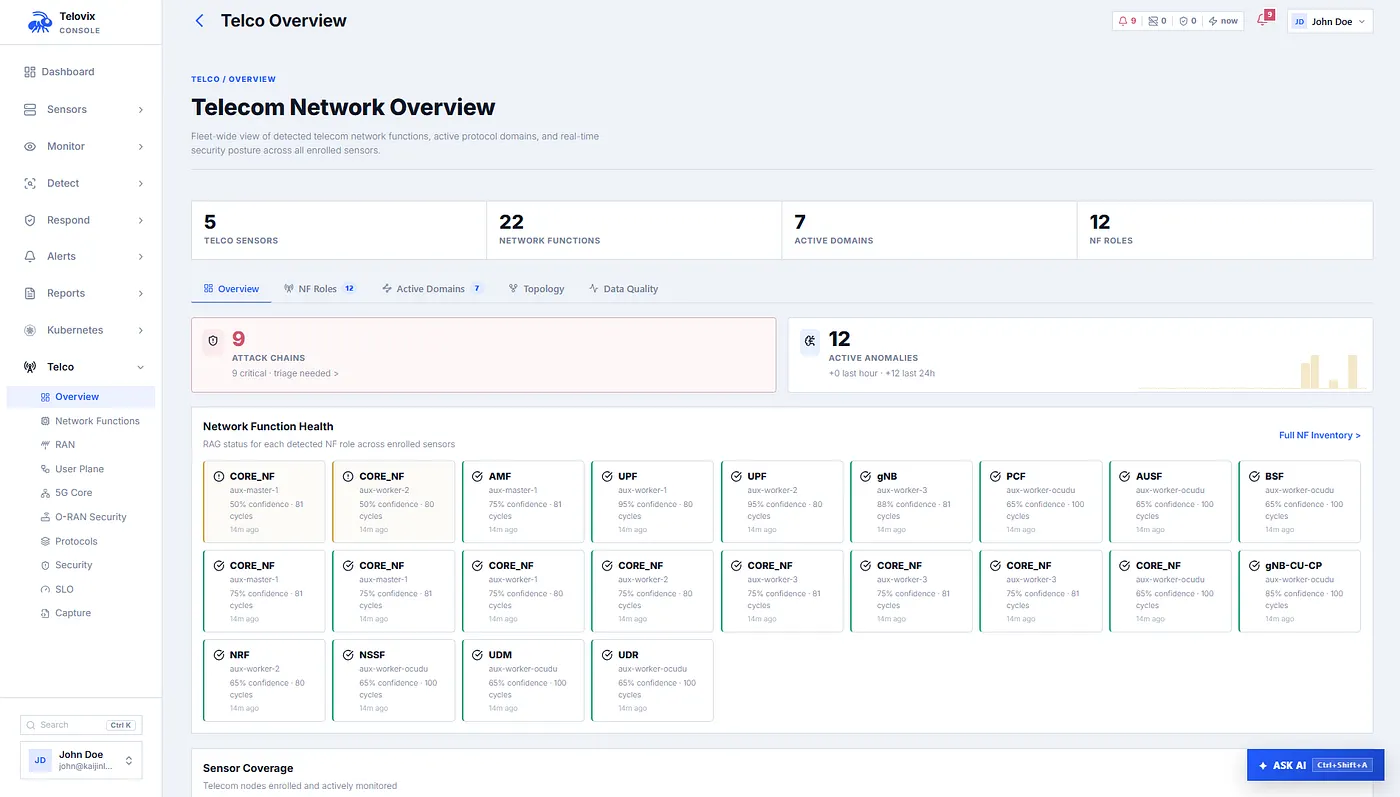
The Console Turns Telemetry Into Telecom Views
The console is not just a place to receive events. It is what makes the sensor usable.
The sensor sends heartbeats, compressed event batches, inventory snapshots, and telecom domain snapshots. The console stores those snapshots by domain: 5G Core, user plane, RAN, protocols, security, SLO, network function state, CNF posture, O-Cloud context, and energy/resource history.
That structure matters because different engineers ask different questions. A core engineer wants to know which AMF, SMF, and UPF roles are active and whether NGAP, PFCP, SBI, and GTP-U look healthy. A user-plane engineer wants PFCP sessions, GTP-U tunnel inventory, TEID anomalies, and kernel-bypass warnings. A RAN engineer wants SCTP health, NGAP/F1AP/E1AP/XnAP/E2AP behavior, timing process state, and peer changes. A security engineer wants process execution, privilege changes, file tamper, CNF drift, token abuse, memory injection, and attack chains.
The console gives those teams different ways into the same evidence.
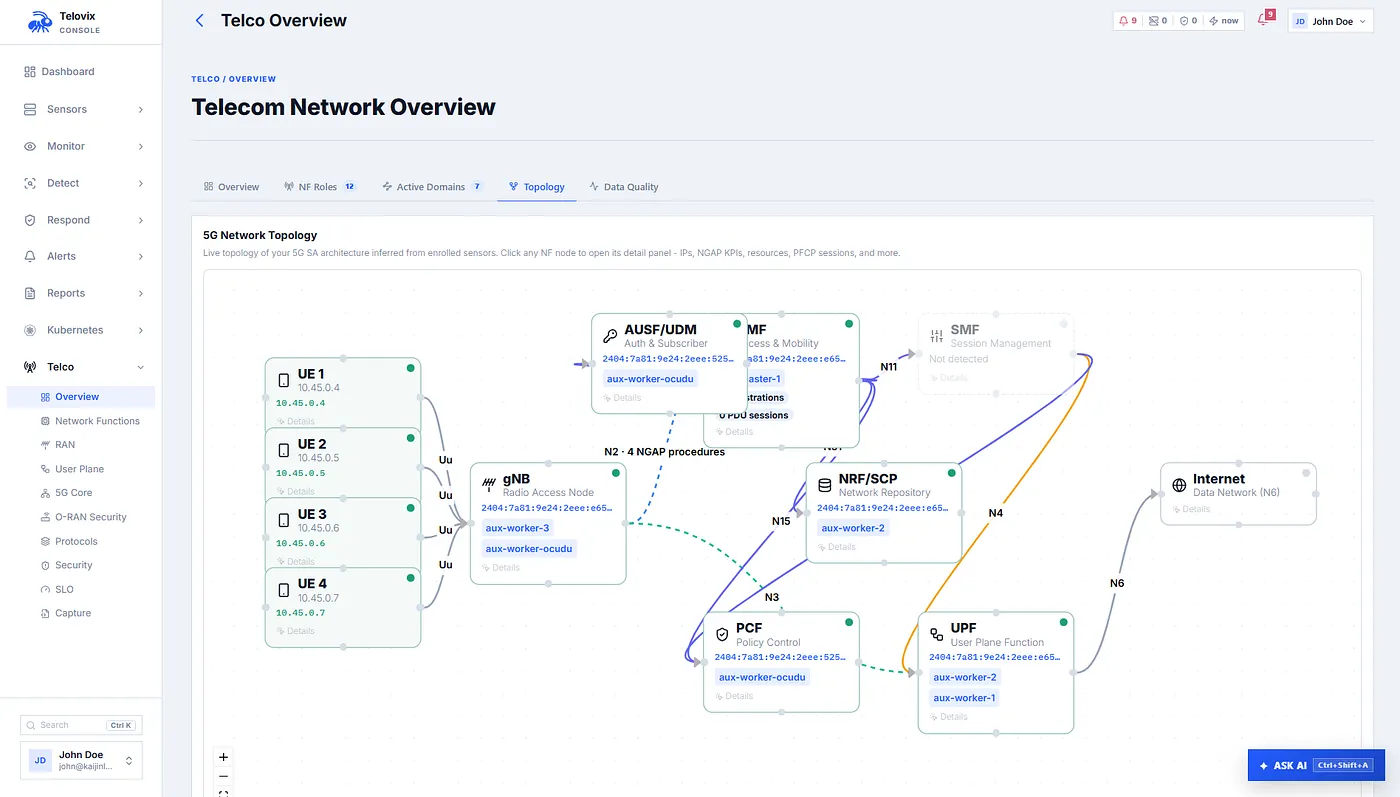
The runtime inspector shows process state, top CPU and memory consumers, active connections, listening services, UDP listeners, recent runtime events, and protocol capture availability. The live feed streams events in near real time and lets engineers filter by sensor, event kind, severity, and text. The telecom views expose NF inventory, user-plane state, protocol analytics, SLO reports, and security findings. The capture endpoint can return a PCAPNG snapshot that opens in Wireshark, but now the packet capture is attached to process and role context instead of floating alone.
The AI assistant layer sits on top of structured telemetry rather than guesses. It can query NGAP KPIs, PFCP sessions, GTP-U tunnels, TLS inventory, SLO metrics, resource metrics, telco snapshots, NF inventory, energy metrics, detection coverage, process fingerprints, enforcement rules, attack chains, and Kubernetes state. That means a question such as “show PFCP session state for UPF nodes” is answered from the same reports the console uses.
This is where the platform starts to feel less like a dashboard and more like an operating loop. Detection coverage tells an operator which roles, packs, and rules are actually covering the behavior they care about. Process fingerprints help distinguish a known NF binary from a lookalike or newly introduced executable. Custom flags let a team promote a local hypothesis into a reusable detection pattern. Red-team exercises let the team define an expected alert kind, trigger the condition, and verify whether the platform caught it inside the exercise window. Those feedback loops are not cosmetic. They are how a telecom security team moves from “we think we detect this” to “we have evidence that this behavior is covered on this class of node.”
The console also gives operators the governance around the data. Policy assignments, enforcement state changes, sensor enrollment, certificate state, custom rules, suppression rules, and audit events are not side notes. In a telecom environment, they are part of the evidence chain. If a blocking policy changes on a UPF node, the system should know who changed it, when it converged, which policy was signed, and what the sensor actually loaded.
This is the difference between a sensor product and an investigation system.
Enforcement, From Detection to Carefully Scoped Response
Detection is the first job. Enforcement is the dangerous one.
The sensor uses Tetragon underneath for the eBPF runtime event and policy layer. That gives the system more than passive visibility. It can observe with Post, kill a process with Signal, or block certain operations with Override when BPF LSM support is available. The distinction matters. A kprobe can often tell you that something happened and, in some cases, kill the process that triggered it. A BPF LSM hook can deny an operation before it completes, such as blocking execution from a mutable path or blocking a kernel module load.
The platform treats enforcement as a staged workflow, not a button to press in anger. Sensors start in observe mode. A pack can move to enforce_ready, where the operator has evidence and a final review gate, and only then to enforced. The Console can preview enforcement impact over recent events, scope a rule to a sensor or group, add exceptions, sign the policy, deliver it through the heartbeat, and require the sensor to verify the signature before loading it. That is the right model for telecom. A rule that is perfectly reasonable on a lab UPF can be catastrophic if applied blindly to every production user-plane node.
The built-in enforcement templates cover the behaviors that often appear after an exploit crosses from protocol input into host compromise: block kernel module loading, block user namespace creation, block raw sockets, block SYS_ADMIN capability assignment, kill ptrace attach, block execution from /tmp, /dev, /run/user, and /proc/self/fd, block memfd_create, block pivot_root, block mount, block unshare, block BPF program loading, and block setting the SUID bit. These are not telecom protocols. They are the host-stage behaviors that turn a protocol vulnerability into persistence, lateral movement, stealth, or node takeover.
Consider the AMF example again. RAN-core fuzzing research shows why exposed cellular parsers deserve attention. If the runtime chain after a suspicious NGAP burst includes an AMF crash, a restart, and a shell from /tmp, the enforcement choice is not to block NGAP. The practical choice may be to enforce block-execve-tmp on AMF nodes after an observation window. If an injected process tries to inspect or manipulate SMF memory, kill-ptrace-attach or a process memory write detection can contain the next step. If a payload uses memfd_create to avoid writing to disk, block-memfd-create becomes relevant. If a compromised CNF tries to load a kernel module, create a user namespace, or mount a new filesystem, LSM-backed override rules can deny those operations.
For user-plane research such as protocol tunneling and boundary bridging, enforcement needs the same care. A GTP-U TEID spray or control-plane tunneling signal may tell the operator where a boundary is failing, but the response may live in several layers: PFCP rule hardening, UPF configuration, CNI policy, network segmentation, and host enforcement against the post-exploitation path. If a UPF-related process opens raw sockets unexpectedly, creates AF_XDP sockets outside the expected acceleration model, accesses VFIO devices without belonging to the approved UPF runtime, or reaches CNI management ports, the dashboard can turn the observed behavior into a scoped enforcement policy instead of relying on a broad static rule.
The custom rule path is where this becomes powerful. The dashboard includes an AI-assisted rule generator that converts a plain-language request into Tetragon TracingPolicy YAML. An operator can describe a behavior such as “detect execution from /tmp by AMF and SMF processes,” “kill ptrace attempts against UPF binaries,” or “observe raw socket creation from telecom namespaces,” then review the generated policy before applying it. This does not remove engineering judgment. It shortens the distance between an investigation and a tailored control, while keeping the policy visible, reviewable, signed, scoped, and reversible.
The best enforcement posture is therefore boring by design. Observe first. Confirm the match. Preview impact. Canary on one sensor. Add exceptions for known-good operational paths. Move to a group only after the signal is clean. Keep BPF LSM prerequisites visible. Preserve the ability to revert to observe mode. In telecom, the system must detect hostile behavior without becoming a new outage mechanism.
A Lab Story, When the UPF Misbehaves
Imagine an Open5GS lab where subscribers can register, sessions come up, and traffic starts flowing through the UPF. At first everything looks healthy. The UPF owns UDP 2152 for GTP-U and UDP 8805 for PFCP. The SMF and UPF exchange PFCP session messages. GTP-U TEIDs appear. CPU and memory are stable.
Then something changes. Traffic drops. A log reports PFCP timeout. Kubernetes shows a restart. A packet capture has gaps.
A generic monitoring stack might leave you with fragments. The telecom eBPF sensor builds a timeline. It knows which process was classified as UPF. It knows the PFCP peer relationship. It knows the TEID table before the issue. It sees the process exit. It sees PFCP liveliness degrade. It sees session deletion activity. It updates the SLO report. It records the resource state around the same window. If kernel-bypass indicators are present, it tells you that GTP-U packet visibility is limited instead of pretending the tunnel table is complete.
The investigation changes from “the UPF had a problem” to a more precise story:
The UPF process restarted, PFCP heartbeat state failed, sessions were lost, and resource or visibility signals changed around the same time.
That is the standard we should expect from eBPF for telecom.
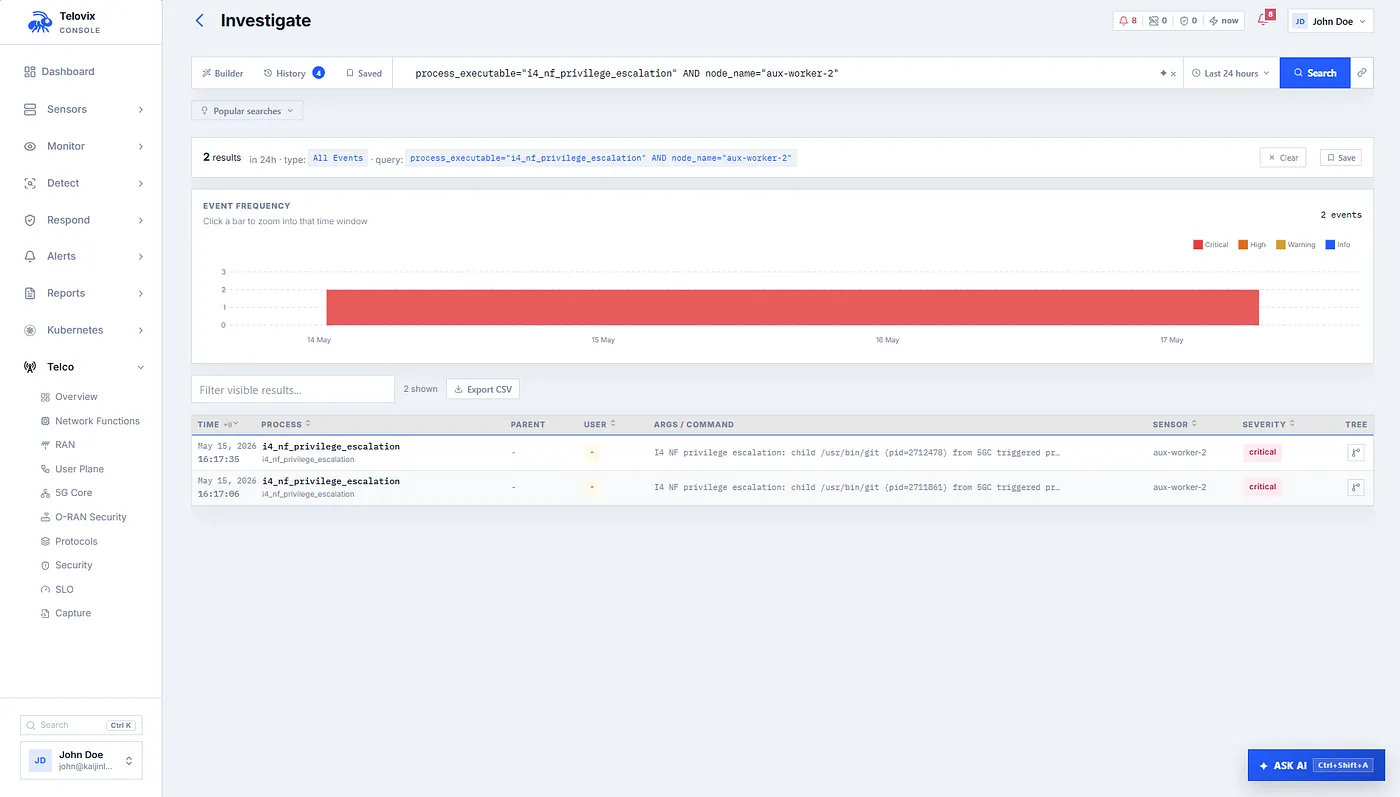
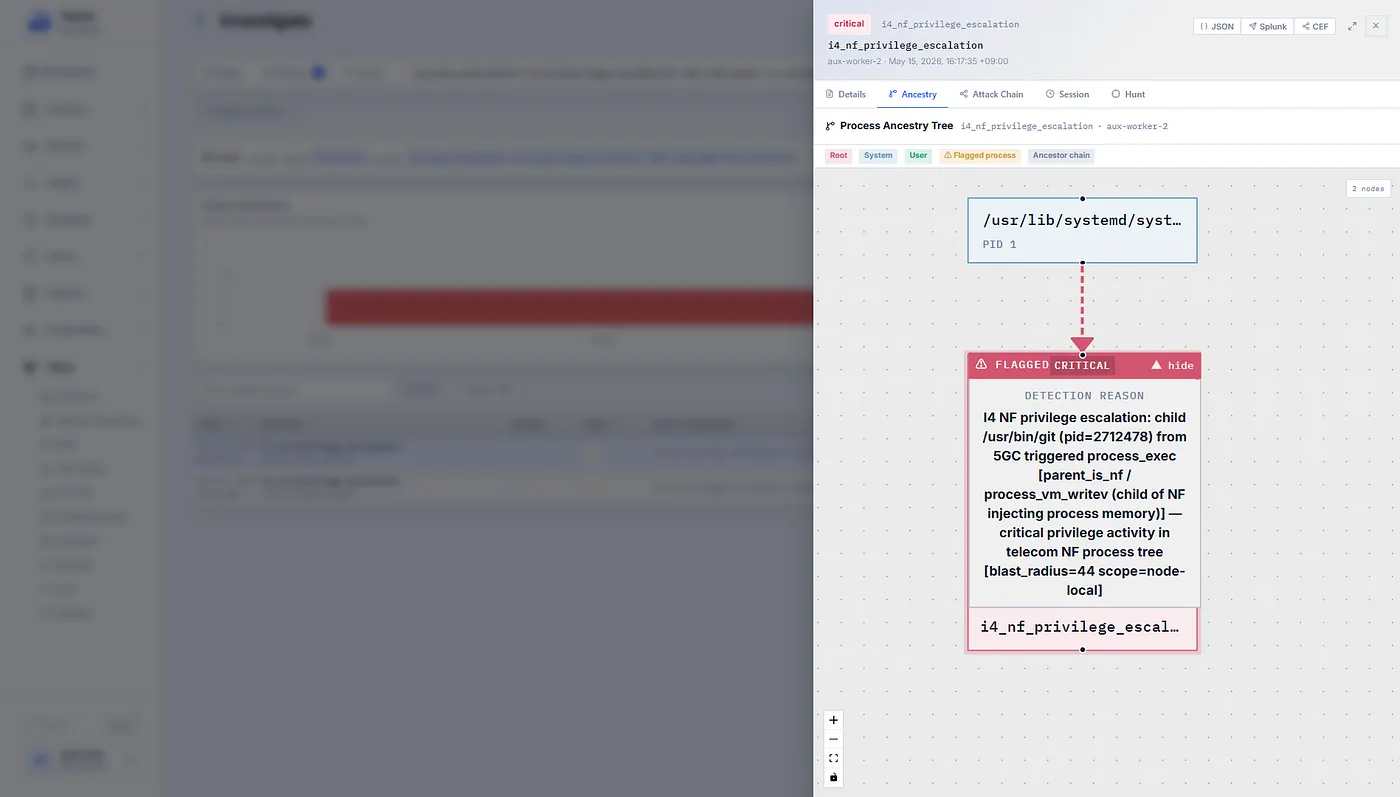
A Lab Story, When the AMF Spawns a Shell
Now imagine a different test. The AMF is running normally. NGAP is active. SBI calls are visible. The process is classified with high confidence. Then a child shell appears under the AMF process tree.
On a Linux machine, /bin/sh is ordinary. Under an AMF, it is not.
The sensor observes the process execution and parent-child relationship through runtime telemetry. The NF classifier gives the parent role. The policy layer understands that a shell spawned by a core network function is anomalous. The console can show the finding with AMF context, related process history, and any surrounding file, network, privilege, or memory events.
That is the heart of role-aware detection. The event is not valuable because the word “shell” is scary. It is valuable because the shell appeared in a process tree where it does not belong.
What Makes This Hard to Copy
The hard part is not attaching eBPF programs. Many teams can collect syscalls and network events.
The hard part is building the telecom model around those events.
That model starts with a standards-derived interface catalog, but it cannot stop there. A port number is only a clue. UDP 2152 may indicate GTP-U, but the useful question is whether the owning process behaves like a UPF, SGW, PGW, or another user-plane component. UDP 8805 may indicate PFCP, but the useful question is whether the sender is acting like an SMF, a UPF, or a peer outside its expected direction. SCTP may carry NGAP, F1AP, E1AP, XnAP, E2AP, Diameter, or M3UA. Without role and protocol context, the system can only say “network activity happened.” With telecom context, it can say which part of the mobile architecture moved.
This is why role classification has to work from behavior, not only from vendor process names. In a lab, the process may be called open5gs-amfd or open5gs-upfd. In a commercial network, names may be wrapped, renamed, containerized, supervised, or hidden behind vendor launchers. A credible sensor has to combine process identity, socket ownership, ports, peers, protocol hints, Kubernetes metadata, namespaces, repeated observations, and confidence scoring. The goal is not to guess once. The goal is to keep a stable understanding of what role a workload is playing as the node changes.
Then comes state. Telecom protocols are not just packets. PFCP has sessions, SEIDs, peer direction, liveliness, PDRs, FARs, URRs, and session transitions. GTP-U has TEIDs, endpoint roles, flags, sequence behavior, and inner payload hints. NGAP has procedures, UE-related identifiers, setup events, context releases, and failure patterns. SBI has caller relationships, API paths, status behavior, token movement, and service graph expectations. If the sensor only emits packet-level facts, the console cannot explain what changed. It needs memory across time.
The hardest engineering lesson was that visibility also has to include the absence of visibility. DPDK, VFIO, AF_XDP, hugepages, and other fast paths may be the correct design for a high-performance UPF or DU, but they also mean normal kernel packet capture may miss the most important data-plane traffic. A generic product may quietly show an empty table. A telecom-aware system has to report the gap, explain why the gap exists, and keep collecting what remains visible: PFCP, process behavior, privilege changes, namespace state, file integrity, resource usage, energy estimates, and kernel guard signals.
TLS created the same kind of discipline. In some Open5GS-style labs, SBI is visible as h2c. In production, SBI is often encrypted. A dynamically linked TLS library may be partially observable through uprobes. A statically linked vendor binary may not be. A Go binary may behave differently again. The system has to say “plaintext,” “covered,” “opaque,” or “unknown” instead of pretending that eBPF means universal decryption. That honesty is part of the product, not a weakness in it.
The same applies to cloud-native telecom. Modern telco networks are not only AMF, SMF, UPF, CU, DU, and RIC. They are also Kubernetes service accounts, container runtime sockets, CNI peers, image drift, mutable filesystem paths, kubelet APIs, API server connections, namespace boundaries, and O-Cloud management surfaces. If a classified AMF reads a Kubernetes token, if a UPF child process touches a container runtime socket, or if a CU process enters the host network namespace, that is not a generic Linux curiosity. It is a telecom security event with a much larger blast radius.
This is why copying the visible surface is easier than copying the system. A dashboard can imitate terminology. A sensor can emit a long list of events. The difficult part is the accumulated judgment: which Linux facts matter on which network function, which protocol state should be remembered, when a missing packet view is a finding, when a role classification is strong enough to drive severity, and when an enforcement recommendation is too dangerous to automate.
Most importantly, you need correlation. The value is not a bigger pile of events. The value is the sentence the system can produce after joining them:
An SMF changed configuration, restarted, and connected to a new peer.
A UPF exited, PFCP liveliness failed, and sessions were lost.
An AMF spawned a shell.
A token first used by one NF role appeared from another.
A GTP-U view is incomplete because the user plane bypassed the kernel.
An alert is not ready for enforcement because its impact preview still shows legitimate binaries.
An expected detection is not assumed to exist; it is validated through coverage, fingerprints, and a red-team exercise.
Those are telecom statements, not generic telemetry statements.
That is what makes the work hard to replicate. It is not one clever hook. It is the continuous joining of kernel evidence, protocol state, NF identity, Kubernetes context, visibility limits, resource movement, and operator workflow until the platform can tell a story an engineer would actually trust.
Where eBPF Fits in the Telecom Toolchain
eBPF does not replace packet brokers, Wireshark, logs, metrics, traces, Kubernetes observability, SIEMs, or assurance platforms. It adds a runtime evidence layer that those tools usually lack.
Packet tools remain essential. If an engineer needs to decode a specific NGAP procedure, inspect a PFCP message, or examine a GTP-U packet that traversed the kernel-visible path, Wireshark and PCAP still matter. Logs remain essential because network functions know application intent that the kernel may never see. Metrics remain essential because operators need long-term trends, SLOs, and capacity planning. Kubernetes observability remains essential because pods, nodes, namespaces, images, and network policies shape how CNFs behave. SIEMs remain essential because telecom incidents rarely stay inside one tool.
The gap is that none of those layers, by itself, reliably answers the runtime question: what did the workload actually do on the host?
That is where eBPF fits. It can observe process execution, parent-child relationships, network connects, listening sockets, UDP sends, DNS lookups, file access, privilege changes, namespace movement, raw socket creation, AF_XDP creation, memory injection patterns, module loads, BPF activity, and other host facts close to the point of execution. In telecom, those facts become powerful because network functions have expected roles. An AMF spawning a shell, an SMF touching hugepages, a UPF reading cluster credentials, or an xApp opening an unexpected external connection means something different from the same event on a generic web service.
The best place for eBPF is therefore not “instead of packets” or “instead of logs.” It is between them. It connects packet evidence to process ownership. It connects a protocol anomaly to the binary and namespace that produced it. It connects a Kubernetes workload to the sockets it actually opened. It connects an SLO breach to a restart, a PFCP liveliness change, a resource spike, or a visibility gap. When a PCAP is available, eBPF makes the PCAP more attributable. When a PCAP is not available because DPDK or VFIO bypassed the kernel path, eBPF can still explain why the packet view is incomplete and show the control-plane and runtime evidence around it.
In a practical telecom workflow, this means the eBPF layer becomes the first place to ask a certain class of questions. Which process owns this PFCP peer? Did the UPF restart before sessions disappeared? Did the AMF spawn anything unusual after the NGAP failure burst? Did a token move from one NF role to another? Did a new CNI peer appear before the routing behavior changed? Is the absence of GTP-U data real, or is a fast path hiding it from kernel capture? These are not questions a packet broker or a Kubernetes dashboard usually answers alone.
Some case study described how eBPF can support real-time telemetry, anomaly detection, security tracing, traffic mirroring, resource insights, and AI/ML-driven analytics in 5G infrastructure. Academic work from IMDEA Networks has argued for eBPF as a way to monitor 5G Core interface activity because it runs at the host kernel level and can observe network functions from that vantage point. Recent research has also warned that eBPF-enabled 5G deployments introduce their own security considerations, including tracing, DoS, information theft, and injection risks.
That matches our experience. eBPF is powerful because it is close to the kernel. That also means the sensor must be treated as part of the trusted control and evidence plane. Policy signing, trust state, kernel guard checks, event loss reporting, staged enforcement, and honest coverage reporting are not extras. They are the engineering discipline required to use eBPF responsibly in telecom.
The console is the other half of that fit. Raw eBPF events are not enough for a NOC, SOC, RAN engineer, core engineer, or platform engineer. Each team needs a view that speaks its language. The same event stream has to become NF inventory, PFCP session reports, GTP-U tunnel inventory, SBI caller graphs, RAN signaling health, CNF drift, attack chains, enforcement previews, resource attribution, and energy history. eBPF supplies the runtime evidence; the telecom model turns it into something operators can act on.
Limitations
Any serious article about eBPF for telecom has to be clear about limits.
The system observes Linux-hosted workloads. It is strongest in cloud-native, containerized, VM-based, or bare-metal Linux deployments where the sensor can run on the host and attach to the relevant kernel and user-space observation points. It does not magically see inside every proprietary appliance, closed baseband device, managed hardware element, or vendor system where the operator cannot deploy a sensor. In those environments, the platform can still reason from adjacent evidence if traffic or management activity reaches a monitored node, but it cannot claim the same depth of host visibility.
Kernel support matters. BTF improves coverage. BPF LSM features require compatible kernels and configuration. Some hooks behave differently across kernel versions and architectures. A deployment with modern BTF, LSM support, and predictable container runtime metadata is not the same as an older edge kernel with limited eBPF features. A professional telecom deployment has to treat that as part of readiness: know which hooks are active, which policies can enforce, which events are observe-only, and whether the sensor is reporting event loss or guard failures.
Packet visibility is not universal. DPDK, VFIO, AF_XDP, and other kernel-bypass paths can hide user-plane packets from normal kernel capture. The correct answer is to detect and report that gap. That is why the sensor treats hugepage access, hugetlbfs mounts, VFIO/UIO paths, AF_XDP sockets, and DPDK-like process execution as coverage evidence. It can still monitor PFCP, process behavior, privileges, file integrity, Kubernetes context, resource use, and energy estimates, but it should not pretend to parse every GTP-U packet if the packet never traversed the kernel path.
TLS visibility depends on how binaries are built. Dynamically linked OpenSSL or GnuTLS is different from a statically linked vendor binary. Go TLS can be affected by compiler decisions. Sidecars, service meshes, proxies, and vendor packaging can move the TLS boundary away from the network function process. Opaque TLS is a real state, not a bug. The system can classify posture, detect plaintext or downgrade conditions, and report where payload-level visibility exists, but it should not describe that as universal decryption.
Protocol parsing needs continuous maintenance. Telecom implementations differ, standards evolve, and lab behavior must be validated against production deployments. Open5GS is an excellent proving ground because it makes 5G Core behavior accessible, but commercial deployments introduce vendor differences, acceleration paths, custom wrappers, service meshes, multi-cluster topologies, private extensions, and operational patterns that a lab will not fully reproduce. The right engineering posture is to learn from the lab, then keep validating against the networks where the sensor will actually run.
Role classification is probabilistic until enough evidence accumulates. A process name can lie. A port can be reused. A container can be renamed. A sidecar can own a connection on behalf of an NF. That is why confidence, repeated observation, peer direction, protocol evidence, and operator review matter. The system should make the best classification it can, but it should preserve enough detail for an engineer to understand why the classification was made.
Energy and power estimates also need careful framing. Per-role wattage based on CPU utilization and TDP is useful for trend analysis and correlation, especially across edge nodes and CNF roles, but it is still an estimate. RAPL and hardware counters improve confidence where available. A power meter is still the reference for exact hardware consumption. The value in the sensor is that energy movement can be correlated with protocol storms, crash loops, tunnel floods, rogue processes, and resource drift instead of being viewed as an isolated infrastructure metric.
Finally, enforcement must be staged. Observing an AMF, SMF, UPF, CU, DU, or RIC is one thing. Killing or blocking behavior on those functions is an operational decision that requires evidence, review, rollback, and trust in the sensor. A rule that blocks execution from /tmp may be reasonable for a hardened AMF group. A rule that affects raw sockets, BPF loading, namespaces, mounts, or memory operations can be dangerous if deployed without understanding the local workload. The platform should help generate and scope controls, but telecom engineers still need change discipline.
These limits do not weaken the case for eBPF. They make the case more credible.
Conclusion, eBPF for Telecom Is Runtime Evidence With Telecom Context
The future of telecom observability will not be built from one data source. Operators will still need packets, logs, metrics, traces, Kubernetes state, assurance systems, and SIEM workflows.
What eBPF adds is runtime truth from the host where the network function actually runs.
The real breakthrough comes when that runtime truth is interpreted through telecom context. A process is not just a process; it may be an AMF, SMF, UPF, CU, DU, RIC, xApp, Diameter node, SIP node, RADIUS server, or SIGTRAN gateway. A socket is not just a socket; it may be NGAP, PFCP, GTP-U, F1AP, E1AP, XnAP, E2AP, SBI, Diameter, SIP, or M3UA. A restart is not just a restart; it may be the first step toward session loss. A missing packet view is not just empty data; it may be a kernel-bypass visibility gap. A CPU spike is not just resource usage; it may be tied to a protocol storm, runtime anomaly, or energy cost.
That was the journey of building the platform. We started with the familiar tools like Open5GS, packet captures, logs, Kubernetes events, and the diagrams every telecom engineer knows. Then the gaps became visible. A packet showed the tunnel but not the process story. A log showed an application error but not the namespace or privilege change around it. Kubernetes showed the pod restart but not the file write, child process, PFCP liveliness failure, or DPDK visibility gap that made the restart matter.
The work became less about collecting more data and more about joining the right evidence. Kernel events had to be translated into telecom language. Telecom protocols had to be remembered as state, not just parsed as bytes. CNF posture had to sit beside AMF, SMF, UPF, CU, DU, and RIC behavior because modern telecom is software on shared infrastructure. Enforcement had to be possible, but staged carefully enough that the security layer would not become an outage source. And every place where visibility was incomplete had to be called out plainly.
That is what we mean by eBPF for telecom.
Not generic kernel telemetry dropped into a telecom cluster. A telecom-aware runtime layer that can detect, classify, correlate, and explain what 5G network functions are doing on Linux.
The architecture diagram still matters. But once the network is running, the kernel tells you what the diagram became.
For those who want to explore Telovix and try it in their own environment, feel free to contact us at https://telovix.com.
Sources and Further Reading
- CNCF, “What is eBPF and why does it matter for observability?”: https://www.cncf.io/blog/2021/06/07/what-is-ebpf-and-why-does-it-matter-for-observability/
- IMDEA Networks, “Monitoring 5G Core Networks Vulnerabilities with eBPF”: https://dspace.networks.imdea.org/handle/20.500.12761/1932
- arXiv, “Vulnerability Analysis of eBPF-enabled Containerized Deployments of 5G Core Networks”: https://arxiv.org/abs/2603.19867
- Nathaniel Bennett et al., “RANsacked: A Domain-Informed Approach for Fuzzing LTE and 5G RAN-Core Interfaces”: https://doi.org/10.1145/3658644.3670320
- Altaf Shaik et al., “New Vulnerabilities in 4G and 5G Cellular Access Network Protocols: Exposing Device Capabilities”: https://doi.org/10.1145/3317549.3319728
- “Uncovering Hidden Paths in 5G: Exploiting Protocol Tunneling and Network Boundary Bridging”: https://doi.org/10.1145/3719027.3765206
- Mincheol Son et al., “CITesting: Systematic Testing of Context Integrity Violations in LTE Core Networks”: https://doi.org/10.1145/3719027.3765230
- “Low-Layer Attacks Against 4G/5G Networks”: https://doi.org/10.1145/3734477.3734725
- Shijie Luo et al., “SNI5GECT: A Practical Approach to Inject aNRchy into 5G NR”, USENIX Security 2025 artifact appendix: https://www.usenix.org/system/files/usenixsecurity25-luo-shijie.pdf
- Jose Dias et al., “5G Network Slicing: Security Challenges, Attack Vectors, and Mitigation Approaches”: https://doi.org/10.3390/s25133940
- “Secure and Trustworthy Open Radio Access Network (O-RAN) Optimization: A Zero-Trust and Federated Learning Framework”: https://doi.org/10.3390/fi17060233
- “Telovix eBPF for modern telco network”: https://docs.telovix.com/